
[Biodiversity Summary][Database][Graphs]
Click on the mapped icons to view a static graph and link to interactive data summary for each study site. Some smart-devices may have difficulty visualizing the interactive resources. Click on the gray square icon for full screen mode.

Click on image above to access table and graphical summary for the total number of each species found at each site.
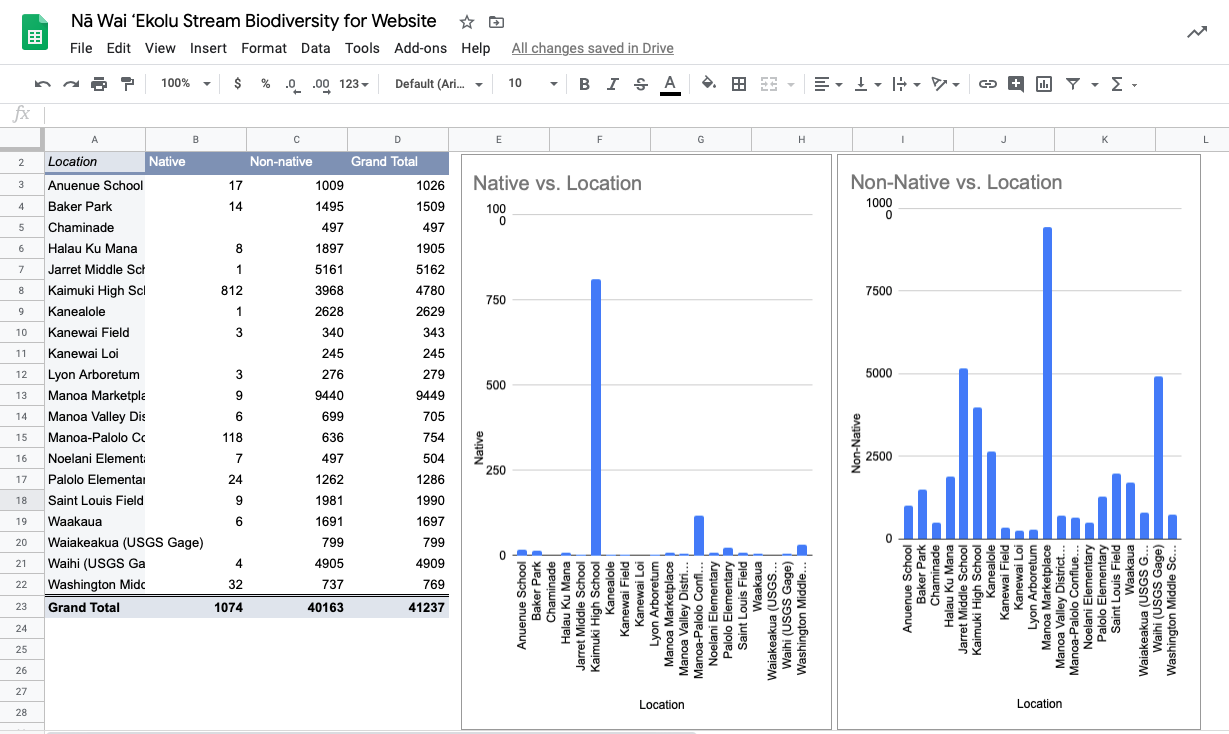
Click on image above to access table and graphical summary for total native and non-native species found at each site.